Tools for the people who run the programs.
Reference material we built because we needed it ourselves, published for anyone administering rental assistance. Free, no sign-in, every claim carrying the citation behind it.
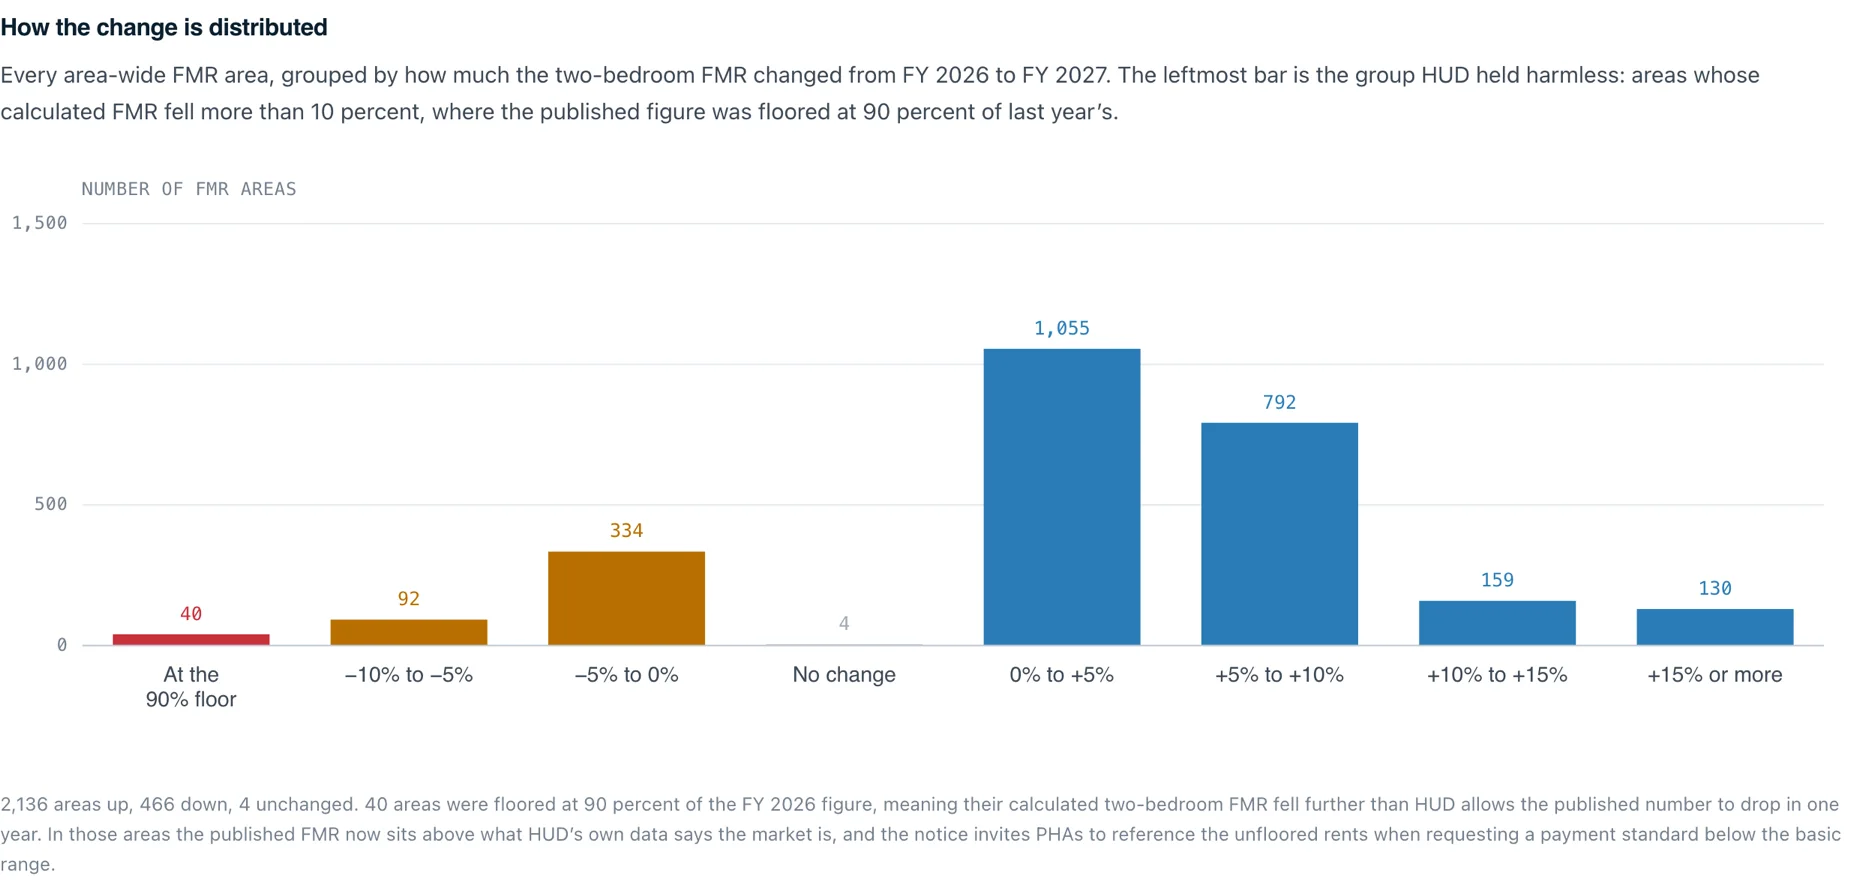
FY 2027 Fair Market Rent changes
Where the FMR moved, and by how much, in every area HUD publishes.
The median FMR area rose 4.2 percent for FY 2027. Weighted by the people who live there the increase is 2.4 percent, and 466 areas came down. This is all 2,606 area-wide FMR areas at every bedroom size, with the distribution, the state rollups, the largest metros, and a searchable table.
- All 2,606 area-wide FMR areas, FY 2026 against FY 2027
- Every bedroom size, with the areas held at the 90 percent floor called out
- Search any area, or sort the whole set by the size of the change
Free · No sign-in · FY 2027 FMRs effective 10/01/2026
HOTMA applicability matrix
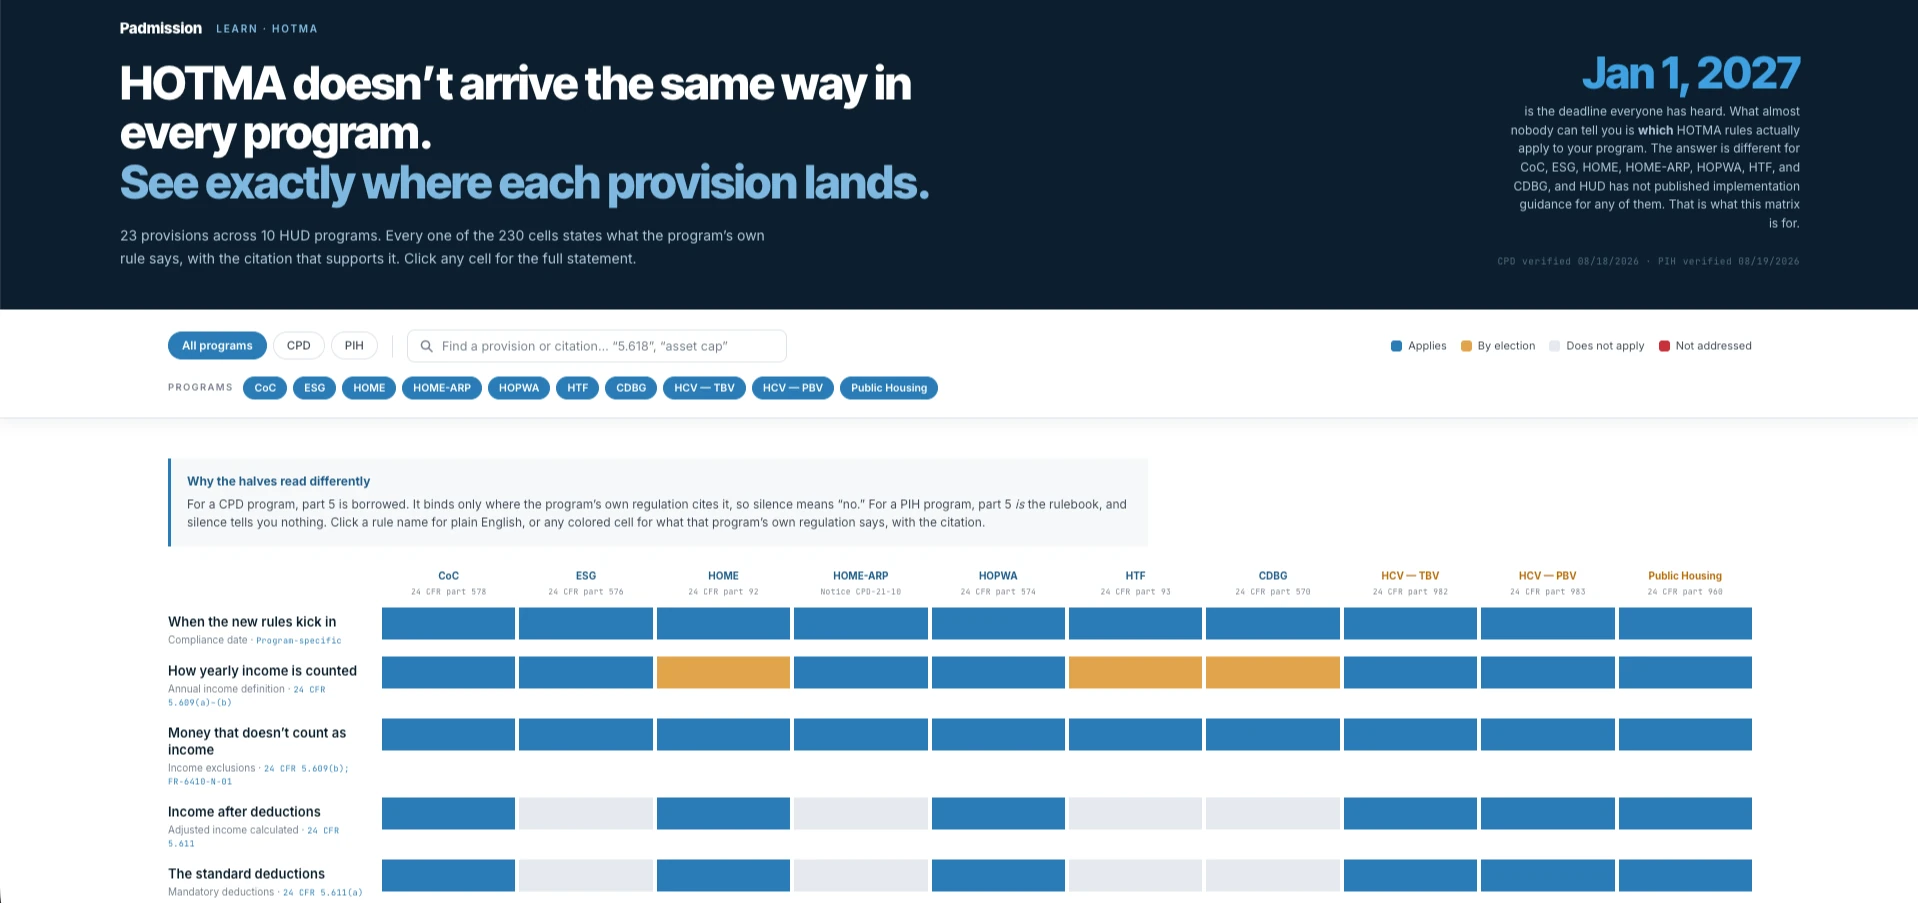
Which HOTMA provisions reach which HUD program.
Most of what the sector calls HOTMA lives in 24 CFR part 5, which was written for Section 8 and public housing. A CPD program is bound only where its own regulation cites it. Every cell here states what that program's own rule says, with the citation that supports it.
- 23 provisions across 10 HUD programs, 230 cells
- A citation in every cell, verified against primary sources
- Filter to the programs you run, or to where they differ
Free · No sign-in · Updated for CY2027 figures
How communities pay for it
HUD mandates and funds HMIS. See how communities fund Padmission to turn that data point into powerful housing program administration and shorter housing search times.
The most common question from a community that has decided it wants this is where the money comes from. The answer is not the same for both products, because they do different work and that work is funded from different lines. Each guide names the sources communities have actually used, and gives you the language for the room.
Free · No sign-in · Each guide ships a funding identification toolkit
Padmission Journey
Rental assistance administration.
Rent calculation, income examinations, inspections and payments are program work — so they are paid for from program lines, not from a grant's capped administration line. HUD is explicit about this, and the guide quotes it.
Rental assistance and supportive services lines · HCV administrative fees · ESG services · county program budgets
Padmission Connect
Landlord engagement and housing search.
A system-level coordination function, funded as one. There is no single dominant source: communities have used CoC and federal budget lines, philanthropic grants, and local government appropriations, often in combination.
CoC Planning · HCV administrative fees · Coordinated Entry operations · foundations and United Way · city and county general funds
Funders see outcomes
The work that produces them is mostly invisible.
Funders resource housing programs and measure outcomes. Between the two sits the work of running them — rent calculation, documentation, payment sequencing, landlord relationships, unit inventory. When that layer is fragmented across providers, the cost does not appear in a grant report. What appears is an underspent allocation and a placement count below projection.
- Why allocations age against deadlines nobody in the system controls
- What it costs when every provider executes rental assistance differently
- How communities are funding the coordination layer directly
Written for funders, and for the grantees describing program operations
Case studies
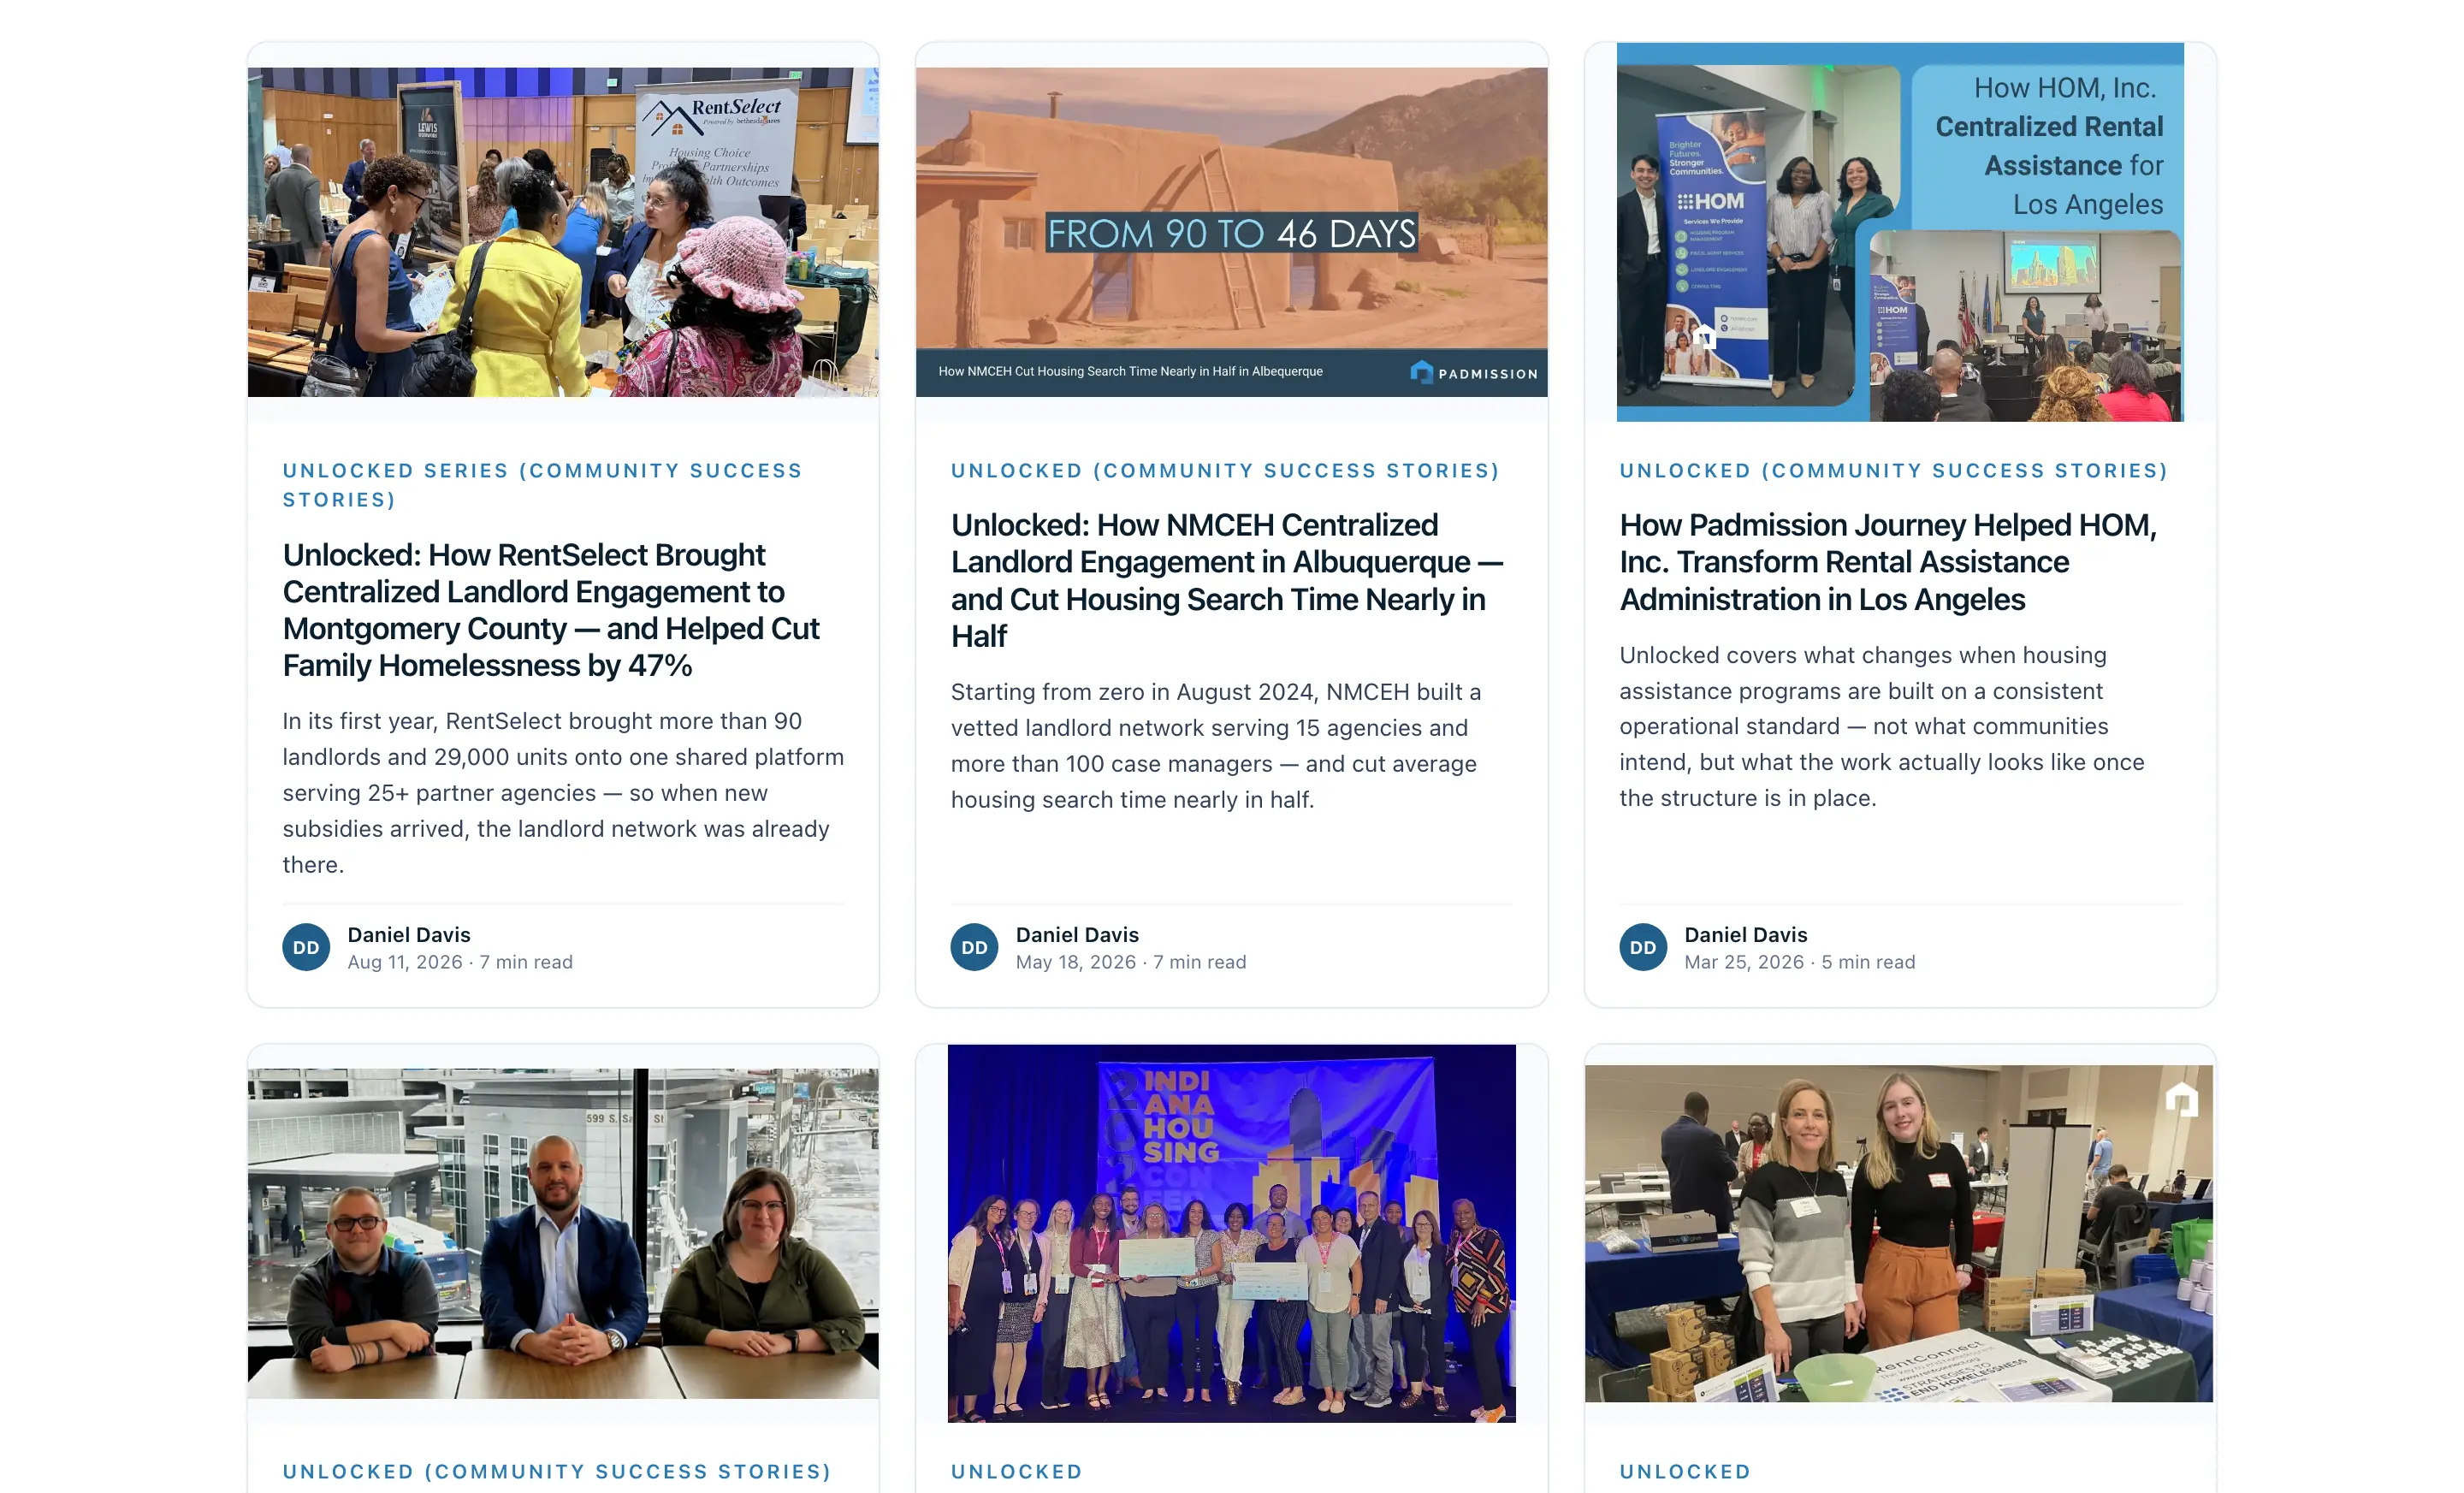
What actually happened when a community centralized the work.
Every Unlocked story, written from the implementation rather than the pitch: what they had before, what they changed, what it cost them to get there, and what moved afterwards. Named communities, named people, and figures they were willing to stand behind.
- RentSelect helped cut family homelessness in Montgomery County by 47%
- NMCEH cut Albuquerque housing search time nearly in half
- HOM, Inc. centralized rental assistance administration for 2,500 Los Angeles households
One-pagers
The short version, for the people who were not in the room.
Single-page overviews to send after a conversation or hand out at a convening. Each covers what the product does, who runs it, and what it changes operationally.
Rental assistance administration: eligibility, income examinations, payments, inspections.
Centralized landlord engagement and housing search across a provider network.
Field inspections on NSPIRE-V standards: severity classification, photo evidence, and reinspection scheduling.
Two systems, two roles: HMIS as the system of record, Journey as the system of action, and what flows between them.